10 Charts That Explain AI in 2026: Progress, Adoption Gaps, and Backlash
Stanford AI Index 2026 and MIT Tech Review give us the clearest data-driven map yet of where AI actually stands
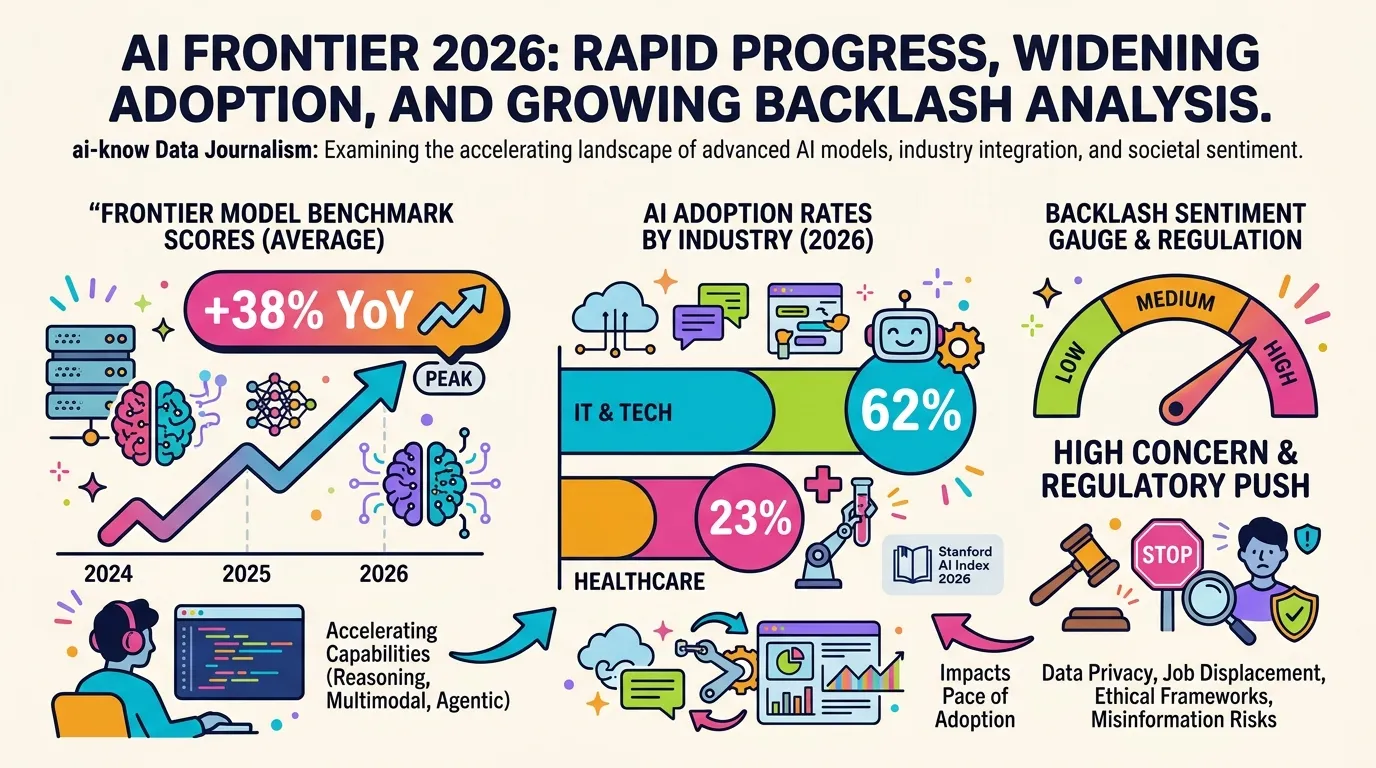
MIT Technology Review published a landmark data visualization feature — “Want to understand the current state of AI? Check out these charts” — drawing primarily on Stanford AI Index 2026. The series maps AI’s trajectory across six axes: model performance, enterprise adoption, investment flows, safety incidents, geopolitical dynamics, and labor market shifts. The picture that emerges is one of two simultaneous, contradictory realities: technical progress that shows no sign of slowing, and social adoption that remains deeply uneven.
Frontier Models: Still No Ceiling
The benchmark data leave little room for ambiguity. Scores for leading LLMs across math, reasoning, and coding improved by an average of 30–40% year-over-year, according to the Stanford AI Index 2026. Those who predicted a scaling wall would materialize in 2025 were wrong — at least on any conventional measure.
What has changed is the LLM Evaluation landscape itself. Traditional benchmarks like MMLU and HumanEval are saturating; the frontier has moved to agentic task evaluation, long-context comprehension, and multilingual capability tests. The Frontier Models are getting better faster than our existing benchmarks can capture.
Adoption: A Tale of Two Industries
The adoption charts reveal a widening gap across sectors. IT, finance, and retail are converging on AI as standard operating infrastructure, while manufacturing, healthcare, and public-sector organizations remain disproportionately stuck at proof-of-concept stage.
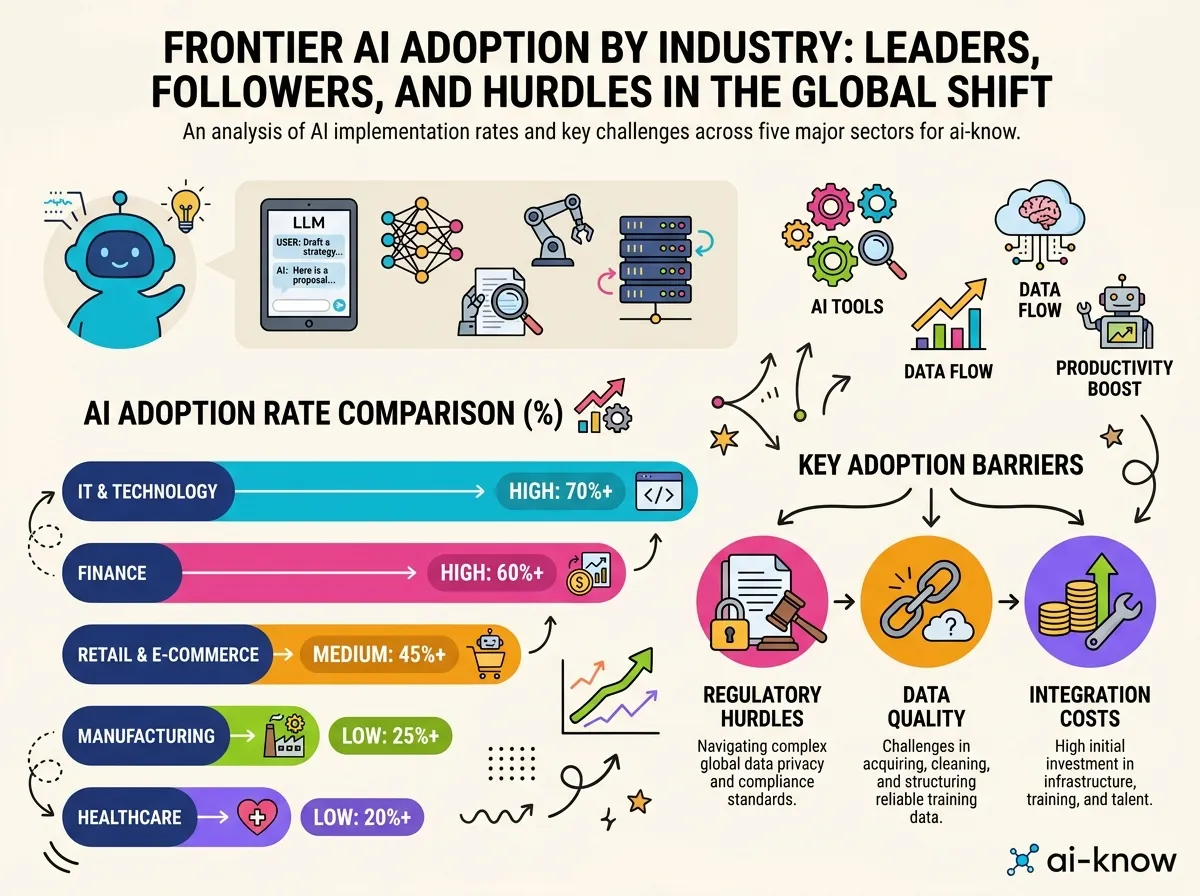
Three structural factors explain the gap: divergent regulatory environments (healthcare AI faces FDA and regional approval hurdles), data quality disparities between sensor-rich and legacy industries, and legacy integration costs. The technology is often ready before the organizational and regulatory context is.
Backlash: When Data Meets Dissent
One of the Index’s most striking findings is that AI backlash is now measurable at scale. Resistance from labor unions, creative communities, and both conservative and progressive political coalitions has crystallized into survey-trackable sentiment — not anecdote, but data.
Is technology moving too fast, or is society adapting too slowly? The charts don’t answer that. They make the question impossible to ignore.
For AI Governance practitioners, the challenge is translating social resistance into workable policy frameworks. The EU AI Act’s enforcement timeline and US sector-specific rulemaking will define the next phase of this negotiation.
Geopolitics and Labor: Decoupling and Redistribution
US-China divergence is now fully apparent in the statistics. Both nations lead the world across patents, publications, and investment — but the data also show accelerating decoupling across model development, training data access, and infrastructure layers. Two distinct AI economies are solidifying.
On labor markets, the dominant early-stage effect is task redesign rather than direct job replacement. Productivity gains are measurable. Who captures those gains remains an open and politically charged question.
Sources: Want to understand the current state of AI? Check out these charts. (MIT Technology Review, 2026)
Related Articles
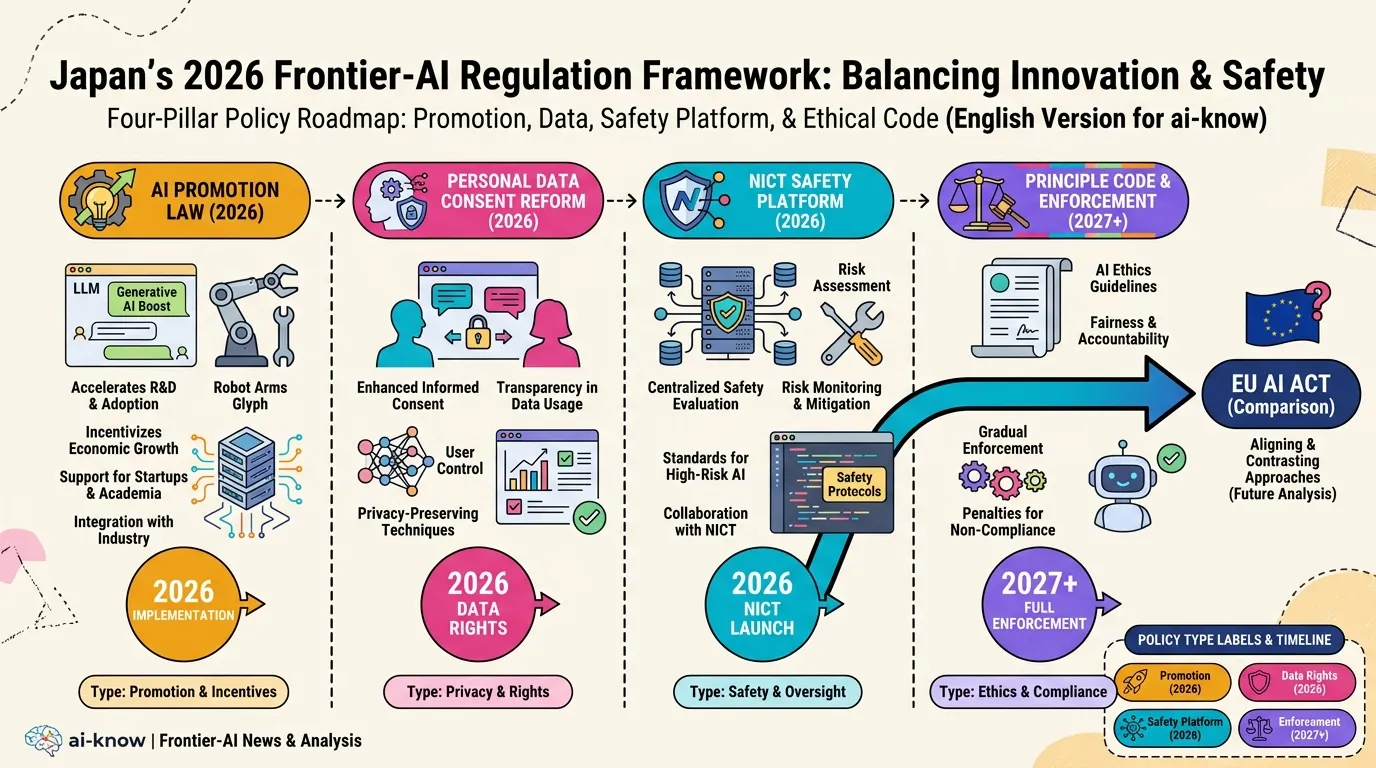
Japan AI Policy 2026: Promotion Law, Data Consent Reform, and the NICT Safety Platform
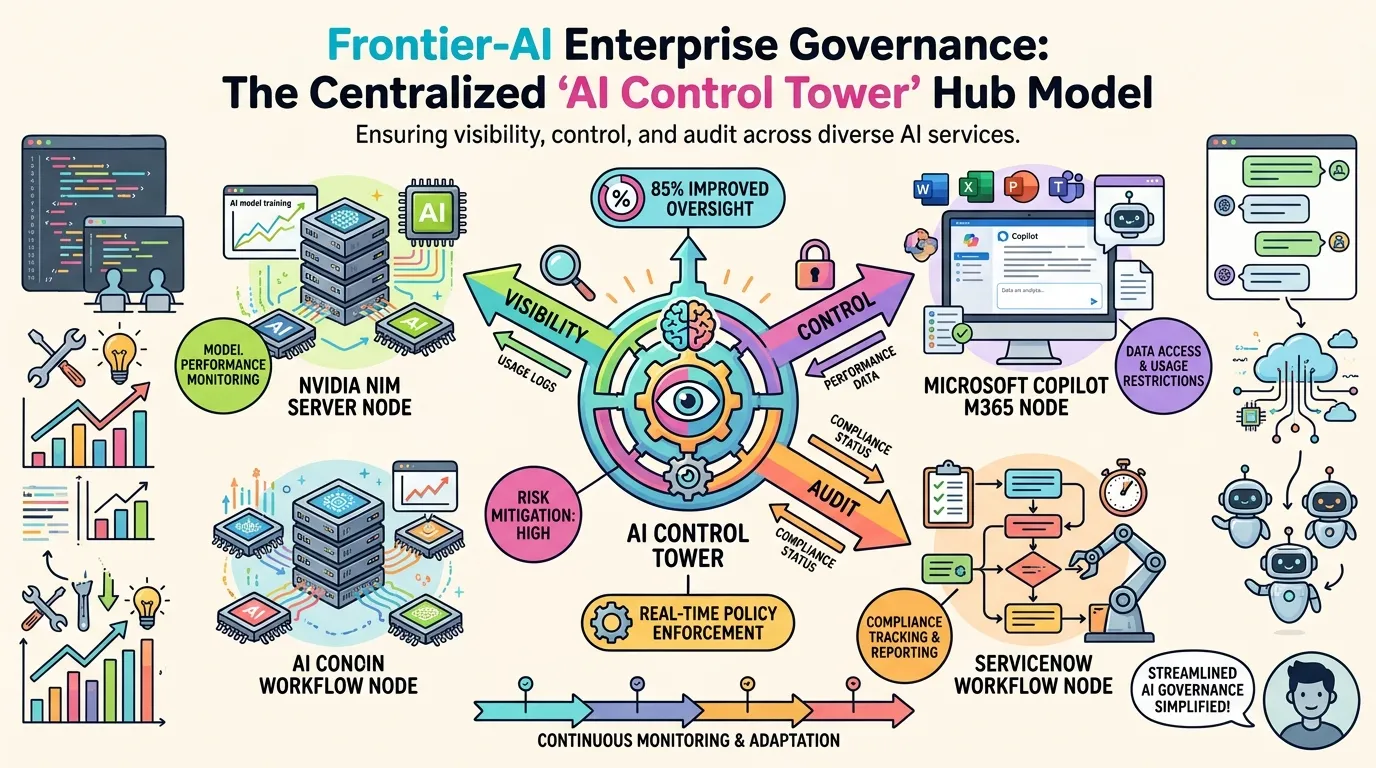
ServiceNow's AI Control Tower: Agentic AI Governance from Desktops to Data Centers
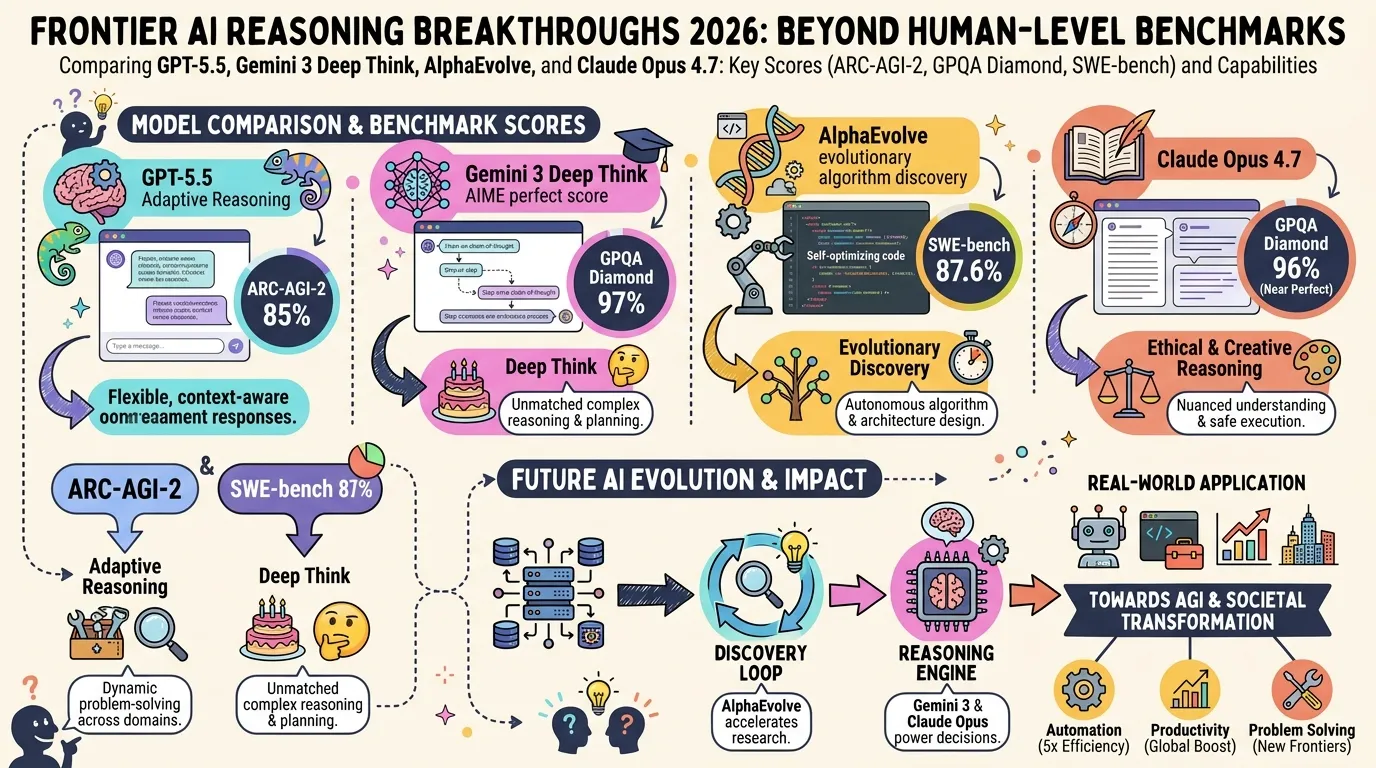
State of LLM Reasoning 2026: Comparing GPT-5.5, Gemini 3 Deep Think, and AlphaEvolve
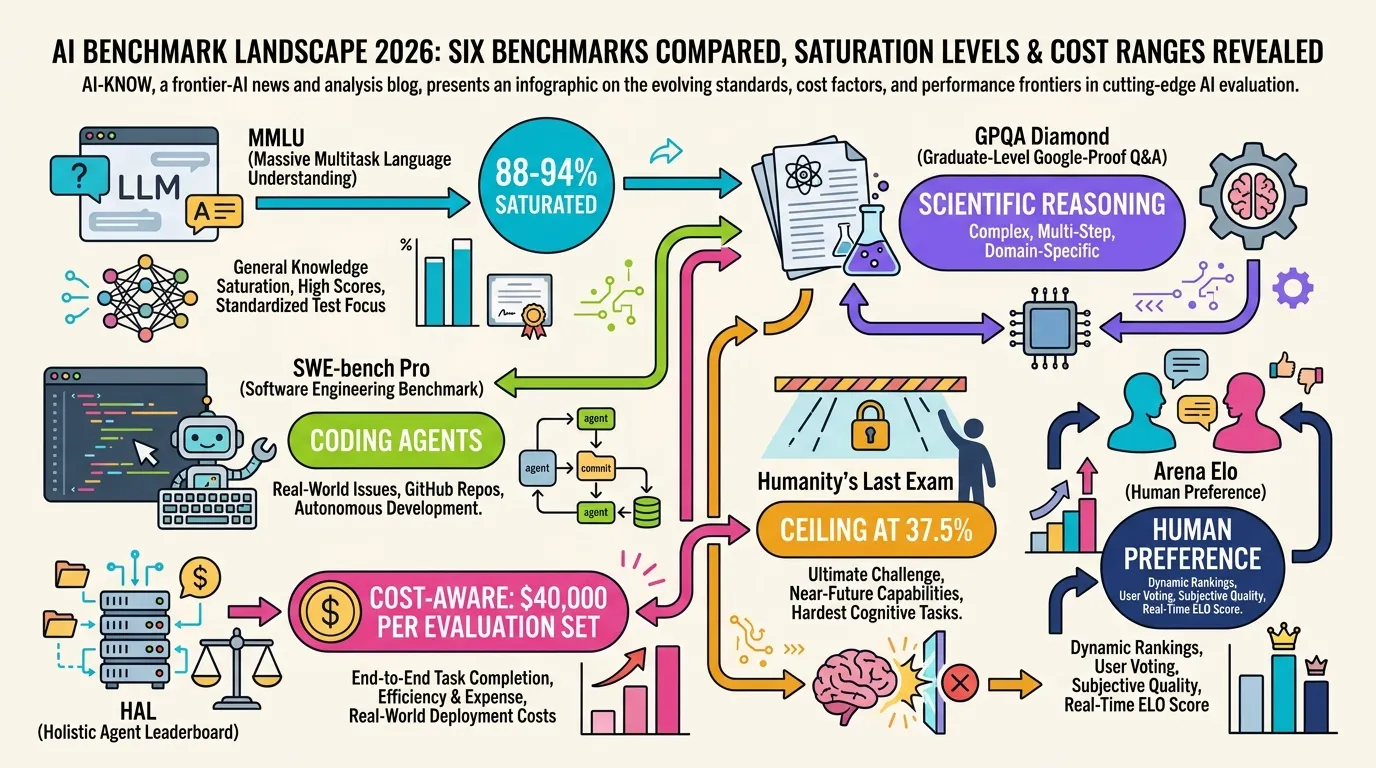
AI Evaluation in 2026: Beyond MMLU — A Practical Guide from SWE-bench Pro to HLE
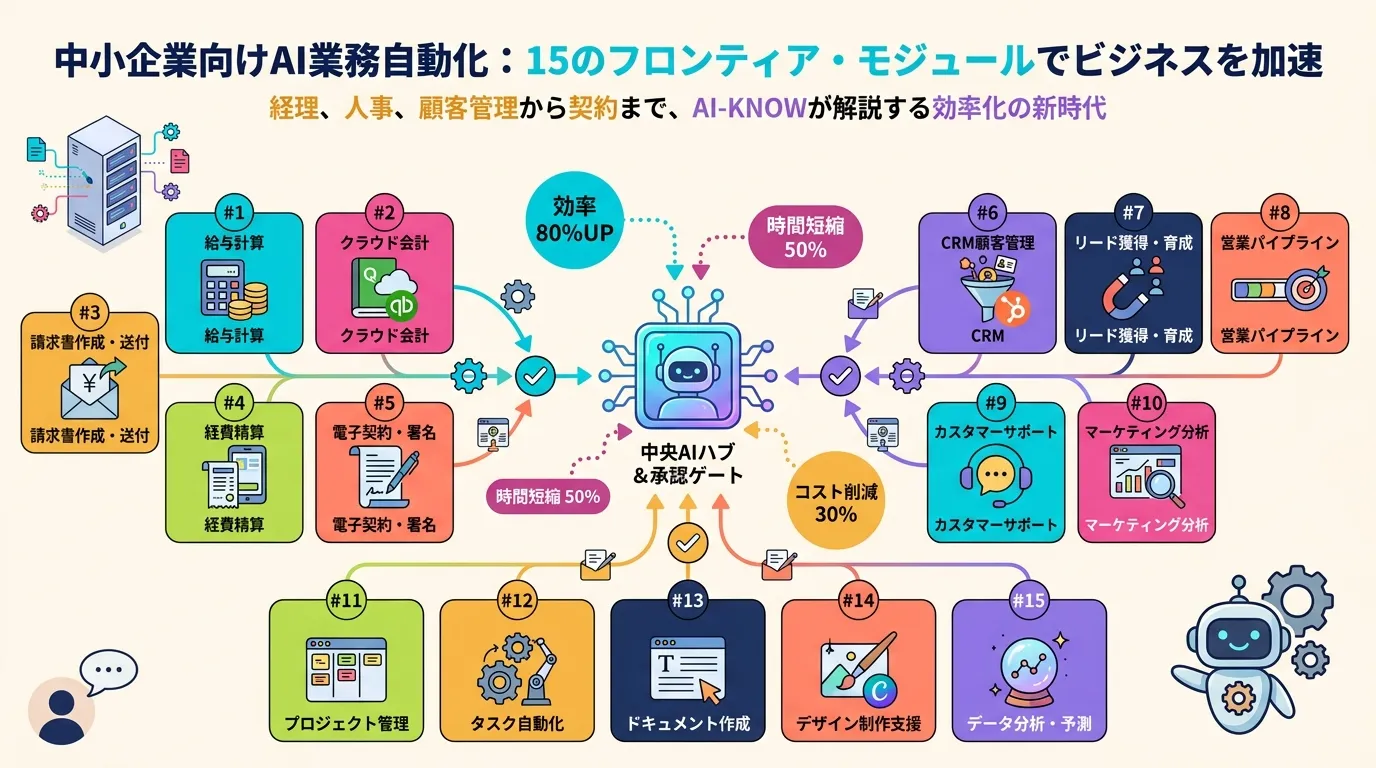
Anthropic Launches Claude for Small Business: 15 Agentic Workflows to Close the SMB AI Gap